by JAY WILDER – October 22, 2018


The Trump Tax Law (more formally, the Tax Cuts and Jobs Act) was huge – the first major rewrite of the tax code in fifteen years – and will give $1.5 trillion in tax cuts over the next 10 years. There is a lively discussion around who’s going to benefit most, but an equally important measure to evaluate its success is its long-term impact on deficits. Will the tax cuts “pay for themselves,” meaning they won’t increase the deficit? Let’s take a look.
The government recently announced the size of the 2018 deficit, and it’s not pretty – it jumped from $666 billion in 2017 to $779 billion this year, an increase of $114 billion. Opponents of the tax law immediately pointed to this result as more proof that the tax cuts were a terrible idea, but that reasoning is misleading for a few reasons. First of all, the deficit is the difference between government spending and government revenue, and government spending has nothing to do with tax cuts – the cuts didn’t cause the $300B spending increase passed in March. Second, the announced 2018 deficit is for fiscal year 2018, which runs from October 2017 through September 2018; the tax cuts didn’t even take effect until January 2018. So is there a better metric that we can use, that more-effectively isolates the impact of the tax cuts on the deficit?
Fortunately, the Department of the Treasury puts out a Monthly Treasury Statement which gives a breakdown of government revenues and government spending for the month. And even better, we don’t have to wait a quarter or a year before it’s available; it comes out a few weeks after the end of the month. And best of all, it has awesome-looking graphs (who knew that the computer from WarGames was still in service? And even better, it’s for sale).
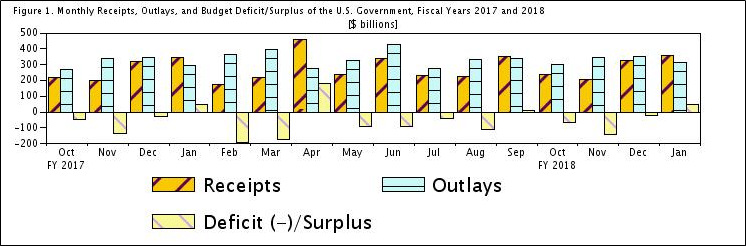
So, let’s focus our attention on government revenues (receipts), starting in January 2018, when the law took effect. But we can get even more targeted; the Treasury report breaks down receipts into several different categories:
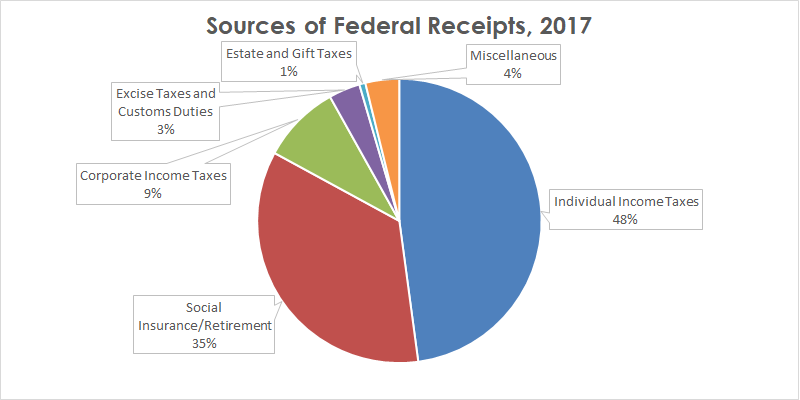
Rather than use the whole pie, we can adjust our metric to only include those sections that were directly impacted by the tax law. Here are three that I’ll lump into Personal Tax Revenues:
- Individual Income Taxes: The lower tax rates in the new law (most rates dropped by 1-3%) will tend to push down receipts; however, any increased raises/bonuses and lower unemployment will increase receipts.
- Social Insurance/Retirement: Social Security and other payroll tax rates were unchanged; however, raises/bonuses and lower unemployment will increase receipts.
- Estate and Gift Taxes: The new law doubled the tax-free threshold for estate taxes from $5.7M to $11.4M, which will decrease receipts.
On the flipside, I expect no direct impact from the tax law on the two sections below, so we’ll leave them out of the metric. This has the advantage of making our metric more targeted and eliminating unrelated “noise:”
- Excise Taxes/Customs Duties: Excise taxes are things like the national gasoline tax; these and customs duties were not changed by the tax law.
- Miscellaneous: These are primarily earnings from the Federal Reserve banking system, which were not changed by the tax law.
That leaves corporate income taxes, which are more complicated. The top corporate tax rate was slashed from 35% to 21%; that lower rate will tend to push down receipts, but any increased profits (from lower tax bills, and longer-term from investments in equipment or people) will increase receipts. But here’s the tricky part: the tax law also significantly reduced the tax rate for “repatriating” overseas profits (converting them to dollars and paying taxes on them), dropping it from 35% to either 15.5% or 8%, depending on whether it’s cash or other assets. It’s estimated that more than $2.6 trillion in corporate profits has been sitting overseas; many companies have been waiting for a tax break to bring them home, rather than repatriating on an annual basis. Overall corporate income taxes normally make up only 9% of overall receipts (I was surprised with how low this number was), under $300B per year. Apple, Citigroup, Goldman Sachs, Bank of America, American Express, and JP Morgan Chase have already announced their intention to pay over $70B in one-time repatriation taxes, and the overall increase from this policy is expected to top $300B. So this repatriation will be a significant portion of overall corporate tax receipts.
How should we view this additional one-time revenue? On one hand, it probably should not be seen as pure “profit” for the new tax law, because the government was always going to be able to tax this revenue; the question was when and at what rate. On the other hand, maybe the law does deserve some credit, if it found an efficient way to bring back as much tax revenue as possible, and sooner rather than later. Another complicating factor is that while this is a one-time “amnesty” for companies (they have to calculate profits under this tax treatment as of the end of 2017), they have up to eight years to pay it off, so the receipts may trickle in over a long period of time. Ideally, I’d like to split out this tax stream separately from the normal corporate taxes, but that may not be possible. But we can do the next best thing, and at least split out corporate tax revenues from personal tax revenues, so that we can track them separately. This means as our metrics, we’ll track Personal (Individual Income, Social Insurance/Retirement, and Estate and Gift Taxes), Corporate (Corporate Income), and Combined receipts.
To put everything into historical context, let’s start by looking at the year-by-year Combined receipts since the Great Recession (I’ve removed the effects of inflation by reporting everything in constant 2018 dollars):
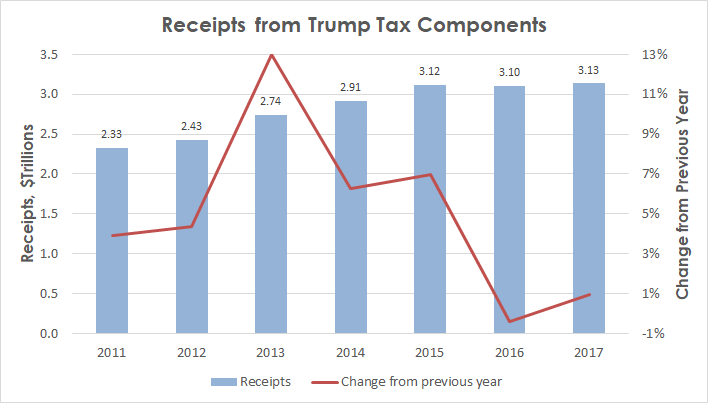
Receipts for these components grew by an average of 5% per year from 2011-2017. But a lot of that growth was during an economic recovery and not sustainable in the long run; something more in line with GDP growth (1 to 3% per year) is probably a more reasonable expectation.
So, how are Combined 2018 receipts looking compared to last year? (Again, everything is in 2018 dollars):
| Jan-Sep 2017 ($ Billions) |
Jan-Sep 2018 ($ Billions) |
Difference ($ Billions) |
Difference (%) |
|
| Personal | 2,207.8 | 2,226.5 | 18.7 | 0.8% |
| Corporate | 226.0 | 140.5 | -85.5 | -37.8% |
| Combined | 2,433.8 | 2,367.0 | -66.8 | -2.7% |
Receipts for personal tax components are looking fair – up a little less than 1% compared to last year. But corporate tax receipts have dropped off a cliff – down $85.5B compared to last year, which brings the combined metric down 2.7% compared to last year. And looking at corporate tax receipts month-by-month, it’s clear that this is not an isolated fluke; the receipts are coming in consistently way lower than last year.

There’s no evidence so far of the one-time repatriation of overseas income; I’m assuming we’ll see some evidence of that in April 2019.
So, to summarize: when analyzing the tax law’s impact on deficits, rather than focus on the deficit as a whole, we should focusing on government receipts, specifically those personal and corporate tax components which were impacted by the new tax law. Historically, we would expect the combined receipts to increase from 1 to 3% per year (absent a recession or recovery), and we’re currently sitting at negative 2.7% compared to last year. This is driven by a significant ($85.5 billion) reduction in corporate tax receipts, which has not been made up for on the personal tax side.
On a related note, as part of the budget deal that was passed in February, the debt limit was suspended until March 2019. This means debt ceiling increases will happen automatically as needed, rather than having to be approved by Congress. So we’ll be spared the political brinksmanship that has accompanied the last several debt ceiling increases, but it does mean that we as voters need to stay informed on the state of our country’s finances.