
by JAY WILDER – October 12, 2018


The Trump tax law (aka Tax Cuts and Jobs Act) was passed with no Democratic votes in either the House or the Senate. As might be expected, the messaging from each party has been starkly different. To the Democrats, the law is a giveaway to the 1%, and to the Republicans, it’s providing middle-class tax relief that will supercharge the economy. Who is right? How can we tell the truth?
Approach
The biggest challenge with answering this question is that our tax code is extremely complex, which makes it difficult to see the underlying patterns when analyzing tax law changes.
But what if we simplify the problem, and focus just on individual taxes (not corporate/business), and instead of the hundreds of inputs that we provide when filling out our taxes, we create a simplified model, using only the inputs that
- Are broadly used by most taxpayers
- Are impacted by the tax changes
Then maybe we can start to see some trends emerge. We narrowed down to the following six inputs:
- Filing Status (Single or Married)
- # of dependent children
- Income
- Long-term Capital Gains
- Combined State and Local Tax deductions
- Combined Mortgage Interest and Charitable Donation deductions
Limiting the inputs and reviewing the IRS tax forms allowed us to write the logic that actually calculates the tax due under the old and the new tax law for tax year 2018. It takes into account exemptions, deductions, tax brackets, long-term capital gains taxes, the Alternative Minimum Tax, and the Child Tax Credit.
Here is a sample of what it spits out:
| 2018 – No Trump | 2018 – Trump | Savings | |
|---|---|---|---|
| Adjusted Gross Income | $130,000 | $130,000 | |
| Exemption Amount | $12,450 | $0 | |
| Standard Deduction | $12,800 | $24,000 | |
| Gross Itemized Deduction | $15,000 | $15,000 | |
| Net Itemized Deduction | $15,000 | $15,000 | |
| Standard/Itemized Deduction | Itemized | Standard | |
| Total Deductions/Exemptions | $27,450 | $24,000 | |
| Taxable Personal Income | $92,550 | $96,000 | |
| Personal Income Tax | $14,445 | $12,999 | $1,446 |
| AMT Income (AMTI) | $125,000 | $125,000 | |
| AMT Exemption | $86,200 | $109,400 | |
| AMT Taxable Personal Income | $28,800 | $5,600 | |
| AMT Personal Income Tax | $7,488 | $1,456 | |
| Additional AMT Due | $0 | $0 | $0 |
| Tax on Long-term Gains | $1,500 | $1,500 | $0 |
| Child Tax Credit | $0 | $2,000 | $2,000 |
| Net Tax (including credits) | $15,945 | $12,499 | $3,446 |
| Tax Rate (%) | 12.27% | 9.61% | |
You can test it out yourself, for example using your own values from filing your 2017 taxes.
Next, we created more than 100,000 scenarios (various combinations of the six inputs, with income values ranging from $40,000 to $1,000,000), and ran them through the tax engine. Using that output, we could see which scenarios and income levels were most favored under the new law, and which were least favored, or even punished. The results were surprising – let’s look at some of the scenarios.
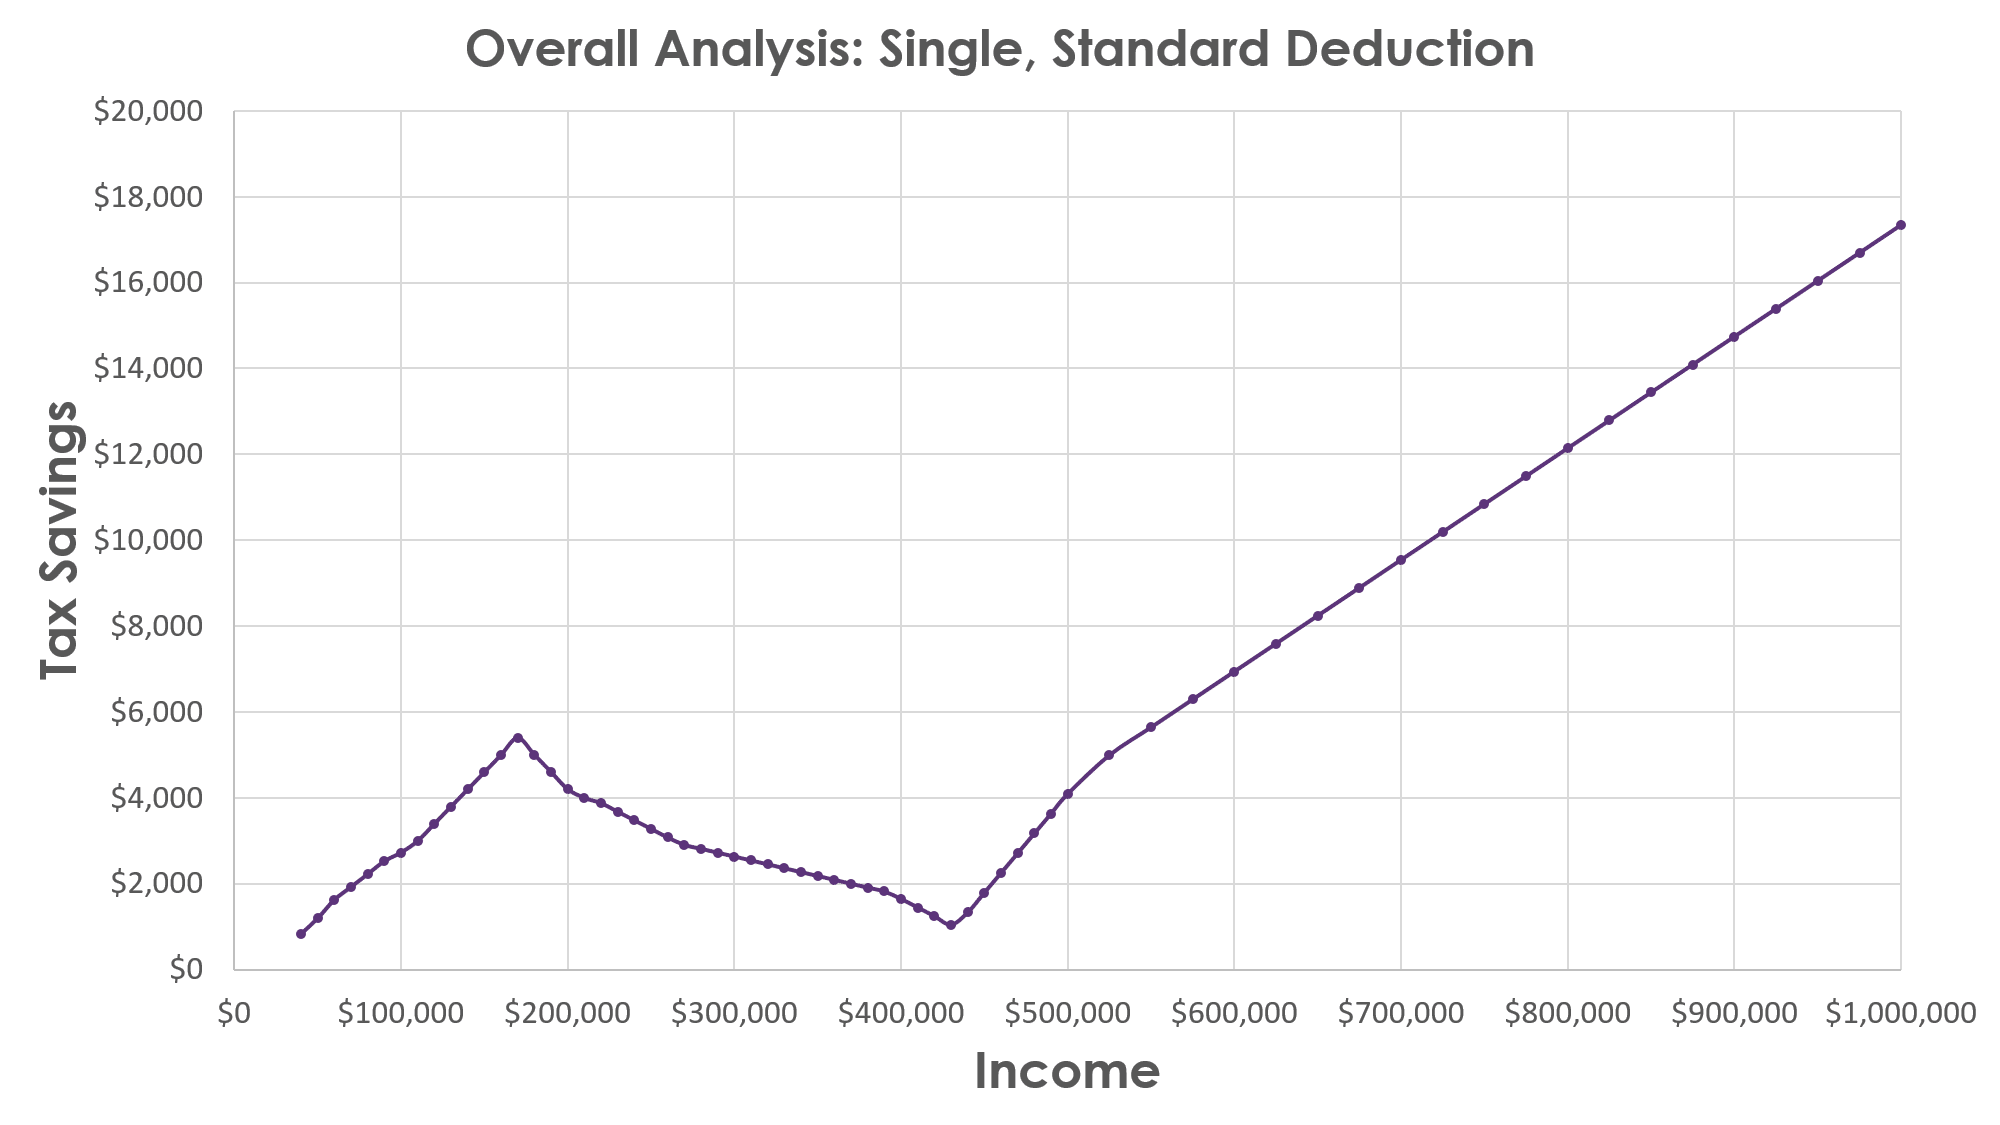
Scenario Group 1: Single, Standard Deduction
When you have a taxpayer filing as Single, using the standard deduction, what is the tax savings under the new law that we see at each income level?
Let’s take a minute to understand this chart, since we’ll use this format with every scenario group. The X-axis represents income level, and for this analysis, this means income level after pre-tax payroll deductions for retirement contributions, healthcare, etc. The Y axis represents tax savings under the new law – so if you would have owed $10,000 under the old law, but now owe $9,000 under the new law, that will show up as a $1,000 savings on the above chart. This does not mean you’re getting a check for $1,000. Just as under the old tax law, the amount of refund or payment due depends on how much has been withheld throughout the year, how much you’ve paid in estimated payments, etc. The focus of this analysis is how much you’re paying in taxes as a whole for tax year 2018, regardless of when and how you pay it.
Getting back to the chart, it certainly was not what we expected. Tax savings starts at about $800 at $40,000 income, increases to over $5,000 at $170,000 income, then decreases before increasing again. So people making $70,000, $380,000, and $450,000 all get roughly $1,900 savings under the new law. And the highest tax savings go to people making $600,000 or more (which was less of a surprise). So the takeaway from this chart is that, indeed, for this scenario group, everyone’s a winner (some more than others).
Scenario Group 2: Single with Itemized Deductions
According to the IRS, about a third of taxpayers use itemized deductions rather than the standard deduction. Deductions are ways to reduce the amount of your income that gets taxed – if you have $100,000 in income, but $20,000 in deductions, that means that you only get taxed on $80,000 in income; the rest is tax-free. One of the most controversial and impactful changes with this law is with the SALT deduction (State And Local Tax deduction). For most people, this is calculated by adding up the state income tax you pay, plus property taxes if you own a home. The new law caps this deduction at $10,000. So, going back to the above example, someone with $100,000 in income and $20,000 in SALT deductions, would have $80,000 in taxable income under the old law. But under the new law, they have $90,000 in taxable income, and would potentially owe more in taxes. What kind of effect will deductions have on the tax savings curve? Let’s take a look:
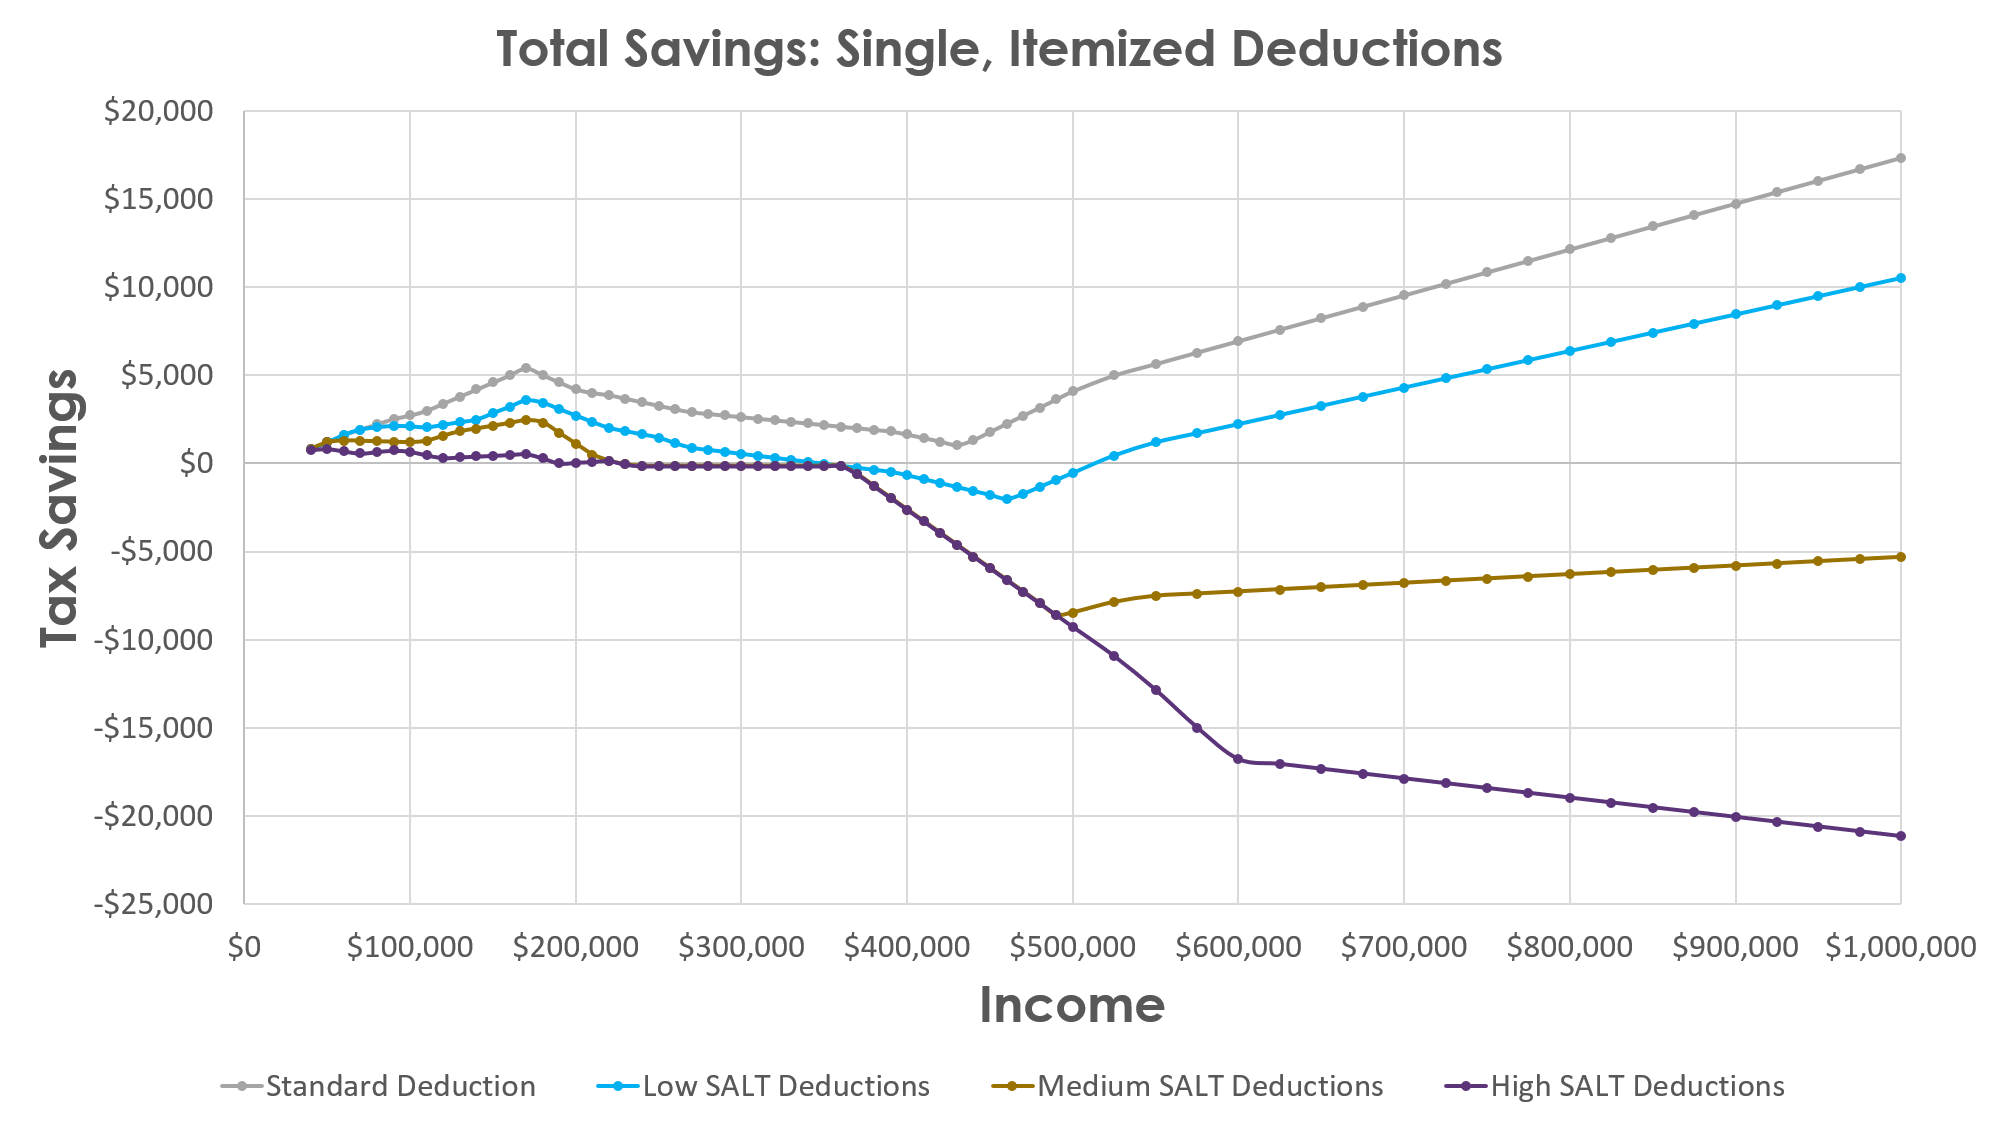
Here are the four lines on the chart:
- Standard Deduction: SALT deduction = $0, Interest/Charity deduction = $0 (same as scenario group 1)
- Low SALT: SALT deduction = 4% of income, Interest/Charity deduction = 5% of income
- Medium SALT: SALT deduction = 8% of income, Interest/Charity deduction = 5% of income
- High SALT: SALT deduction = 12% of income, Interest/Charity deduction = 5% of income
Check out our Single tax video to get a detailed breakdown of the different tax components that make up these tax savings curves (changes to tax brackets, deductions/exemptions, and the Alternative Minimum Tax). But you can see that we have our first examples of people who are getting a tax increase. The tax savings lines go below $0 at higher income levels for the Low, Medium, and High SALT scenarios. So now, almost everyone’s a winner.
And let’s zoom in on income levels below $250,000, so that it’s easier to see how the tax savings differ between the scenarios:

You can see there’s significantly less tax savings for higher SALT deductions starting at around $60,000 in income. At $70,000 in income, for example, lower SALT deductions save about $2,000, but medium and high SALT deductions only save between $600-$1,300.
Scenario Group 3: Married with Children
Let’s see how the picture changes when we analyze married taxpayers with two kids, using the same rules as before for Low, Medium, and High SALT deductions:
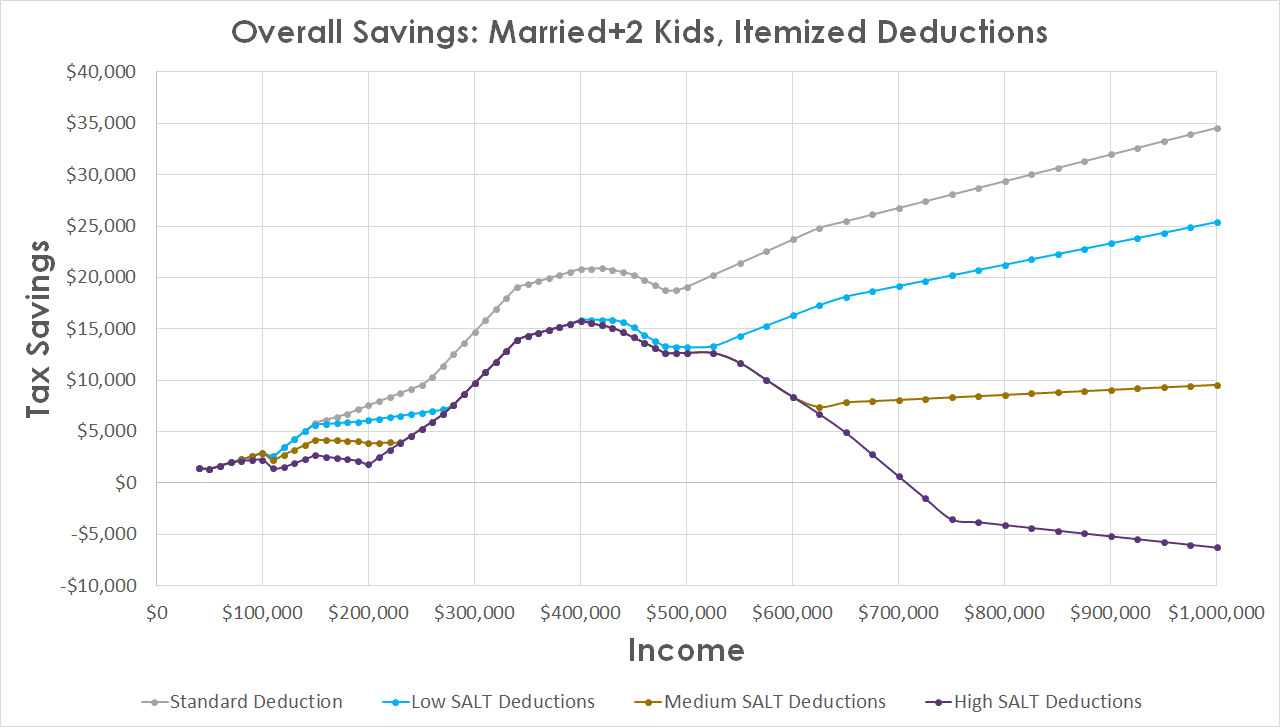
When compared to singles, married taxpayers do very well under the new tax law – there isn’t the “dip” at $170,000 in income; instead the savings increase significantly – find out why. There are not as many scenarios where people will see a tax increase; only high-SALT taxpayers making over $700,000. So again, almost everyone’s a winner.
But let’s zoom in on the part of the curve under $300,000:
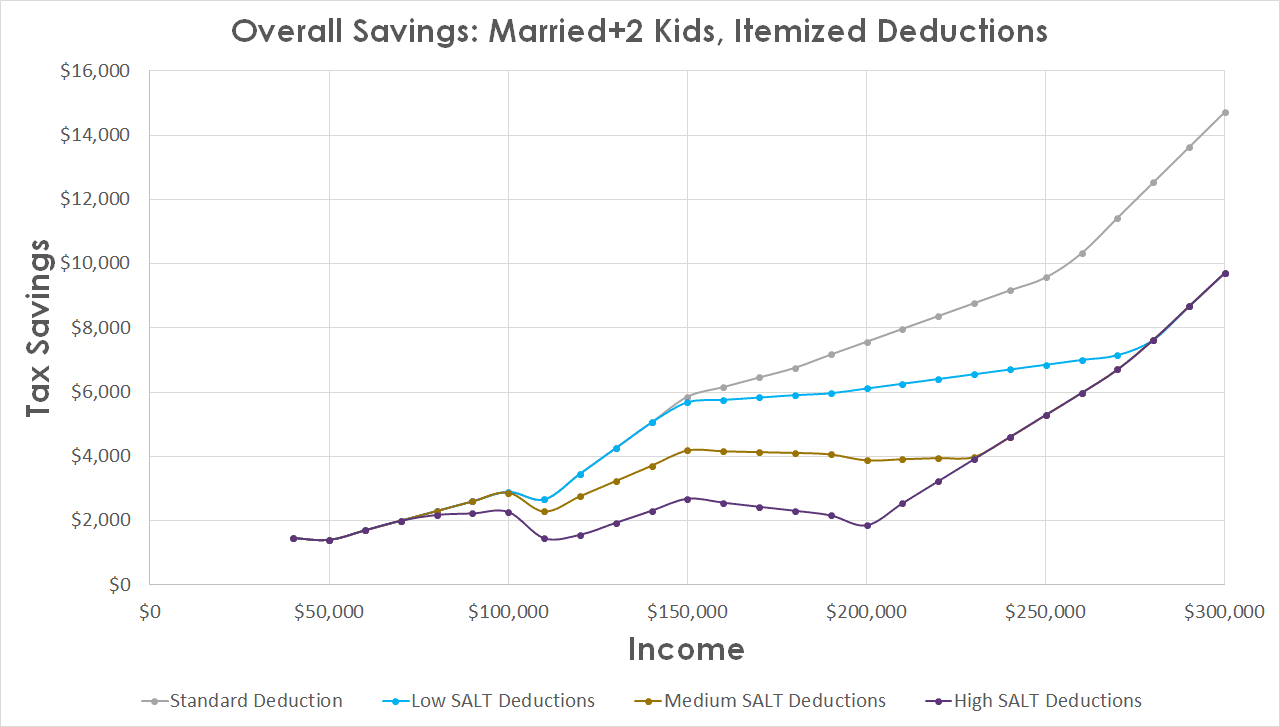
Notice that the savings start at over $1,400 at the $40,000 income level, mainly because of increases to the child tax credit. In contrast to single taxpayers, who don’t see $6,000 in savings unless they’re over $550,000 in income, married taxpayers can see that level of savings as low as $150,000 in income. And for married taxpayers, living in a high-tax area starts to significantly reduce savings starting at about $110,000 in income; at the $120,000 income level, low SALT taxpayers save $3,500; high SALT taxpayers save $1,600.
Summary
Here is what we see for tax savings by income level in the different scenarios:
- Almost everyone will see some level of savings from the new tax law. The only taxpayers who won’t are those with higher SALT deductions, and incomes > $200,000 for Single filers, $700,000 for Married filers.
- Married taxpayers with kids will see significantly bigger savings than single taxpayers at all income and deduction levels.
- Having higher SALT deductions will significantly reduce your tax savings starting at $60,000 in income for single taxpayers, and $110,000 in income for married taxpayers.
So if almost everyone is saving money on their taxes, what’s the downside of the tax cuts? Should we be worried about the deficit? And if so, how can we tell if the tax cuts are adding to it?