


by JAY WILDER – December 21, 2020
At first glance, the 2020 election might seem like a mirror image of 2016. In both elections, the electoral college count was 306 to 232, which sounds like a fairly comfortable win. But both times, that margin was the result of incredibly narrow victories across a few battleground states and the winner-take-all approach to electoral college votes. In 2016, Hillary Clinton lost Michigan, Wisconsin, and Pennsylvania by a combined 78,000 votes; if she had won over that small number of voters, she would have won the election with 278 electoral college votes to Donald Trump’s 260. Likewise, in 2020, Trump lost Wisconsin, Arizona, and Georgia by a combined 44,000 votes; if he could have overcome that margin, the election would have ended up in a 269-269 tie, sending the decision to the House of Representatives. Go a step further and consider that Joe Biden won Nebraska’s 2nd Congressional District by just 18,000 votes and Trump was just 62,000 votes away from a 270-268 victory. That’s why, at first glance, it seems like both elections were determined by razor-thin vote margins. If you accept that idea at face value, you would probably think that Trump did roughly the same in 2020 as he did in 2016.
A more complete look at the data demonstrates that Trump actually did a lot worse in 2020 than he did in 2016. We know that Trump lost the popular vote by roughly 3 million in 2016 and by roughly 7 million in 2020. But was that increase just because a few blue states got more anti-Trump in 2020, or was it more widespread? To dig deeper, I took a look at the popular vote margin of victory state by state, noted the percentage difference between Trump and Clinton in 2016, and compared that to the difference between Trump and Biden in 2020. The results were surprising:

There’s a lot going on in that chart, so let me explain. The positive percentages at the top of the chart are states where Trump did better in 2020 than in 2016, either winning by more or losing by less. The negative percentages in the middle and bottom of the chart are states where he did worse in 2020 compared to 2016. As an example, in the state where Trump’s numbers improved the most (Hawaii! Who would have guessed it?!), in 2016, he lost by 32.2%, whereas in 2020 he only lost by 29.5%, an improvement of 2.7%. Blue bars represent Democrat states in both 2016 and 2020; red bars represent Republican states in both 2016 and 2020. The gradient bars (that change from red to blue) represent the five states Trump won in 2016 but that flipped to Biden in 2020.
Some facts worth noting:
- Trump’s numbers improved in only seven states; he did worse in 43 states, as well as D.C.
- As I mentioned above, Trump’s most-improved state was Hawaii, where his numbers went up by 2.7%. But his numbers dropped by more than 2.7% in 28 states (including 15 red states).
- If you take a close look at the five states that flipped to Biden—states where Trump and his team are claiming widespread fraud—you’ll see that they are pretty well in line with his performance in other states. Michigan, which flipped to blue (-3.0%) had exactly the median performance that he saw across all states. In two of the flipped states (Wisconsin and Pennsylvania), he did better than the median. In two of the flipped states (Arizona and Georgia), he did worse than the median. In Georgia, he did 5.4% worse in 2020, which isn’t even in the top 10 worst state drop-offs for him. And it’s not even the worst performance in a 2016 red state for him—in both Nebraska and Kansas, he did about 6% worse in 2020.
Just for fun, here’s what the state-by-state performance looks like on a map. The darker the red, the better Trump did compared to 2016; the darker the blue, the worse he did (This might be the first political map where both California and Hawaii show as red):
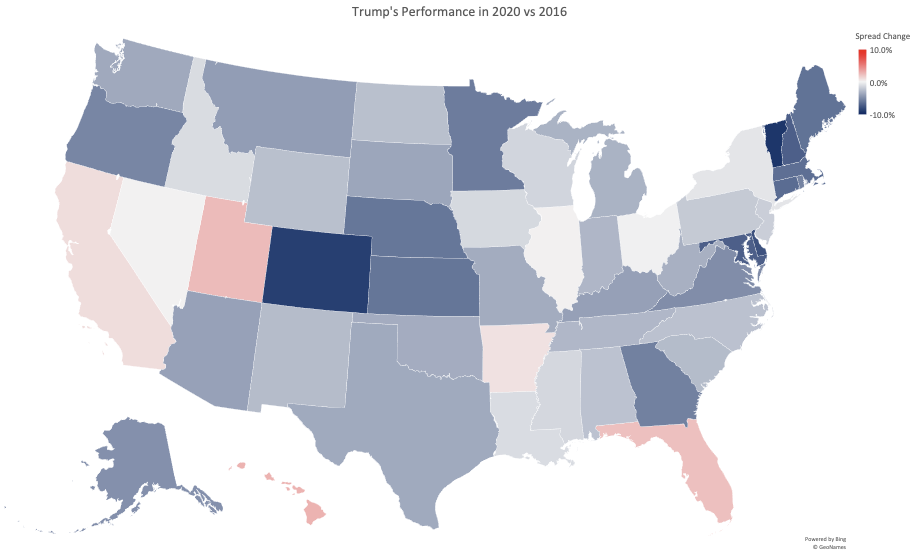
Again, looking at this map, the five states that flipped don’t particularly stand out. So, if there was election fraud, it certainly was camouflaged to fit into his average drop in performance.
Something else that is important to note here: These are all net percentage comparisons between Trump and his opponents. When looking at a raw number of votes received, Trump got 11 million more votes in 2020 than he did in 2016. His problem was that Biden got over 15 million more votes in 2020 than Clinton got in 2016. So, one way to look at this is that while Trump got his base out, he also prompted a lot of anti-Trump voters to go to the polls. And not just in blue states, but in red states as well.
One of my next projects: see if Obama 2008 vs 2012 saw a similar drop-off in performance.
Nice one, Jay! Your site kicks ass.
But what about Hugo Chavez?